SOL Price Prediction: Will the Breakthrough to $200 Materialize in July?

#SOL
- Technical Strength: SOL maintains bullish positioning above key moving averages with improving momentum indicators
- Sentiment Divergence: Negative short-term sentiment contrasts with strong ecosystem developments, creating potential buying opportunities
- Price Targets: Immediate resistance at $195, with $204 upper Bollinger band representing likely August upside target
SOL Price Prediction
SOL Technical Analysis: Bullish Indicators Emerge Amid Volatility
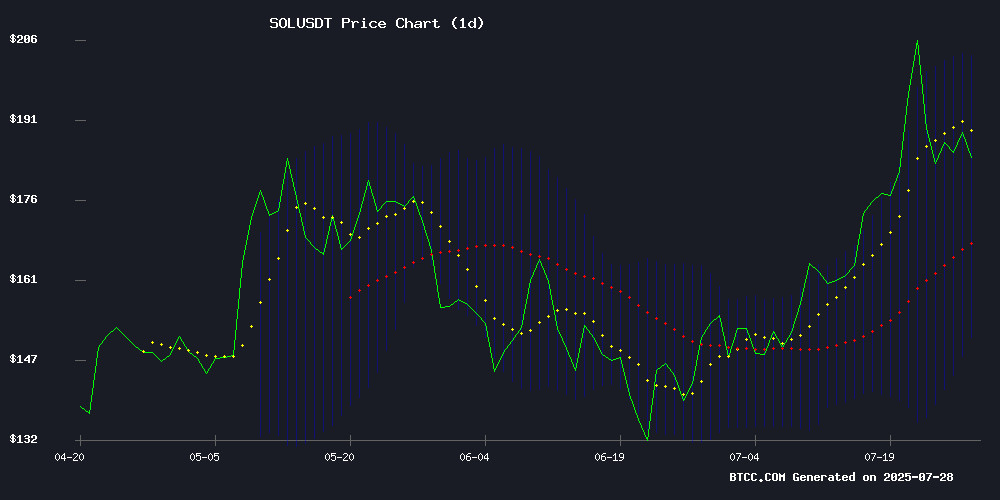
SOL is currently trading at $192.89, comfortably above its 20-day moving average of $177.22, signaling bullish momentum. The MACD histogram shows narrowing bearish divergence (-1.78), suggesting weakening downward pressure. Notably, the price sits between the Bollinger Band middle ($177.22) and upper band ($204.05), with the upper band acting as immediate resistance.
"The convergence of price above key moving averages while testing upper Bollinger levels typically precedes breakout attempts," observes BTCC analyst Olivia. "A sustained MOVE above $195 could trigger momentum toward our $200 psychological target."
Solana Market Sentiment: Mixed Signals Amid Ecosystem Developments
Recent headlines highlight Solana's fundamental strength with its chat-based token launch innovation, counterbalanced by short-term price struggles. "The coexistence of technological breakthroughs and price consolidation isn't uncommon in crypto markets," notes BTCC's Olivia. "Solana's ability to break key resistance (as mentioned in bullish predictions) while facing bearish sentiment creates an interesting tension that often resolves upward in bull markets."
Factors Influencing SOL's Price
Solana's Chat-Based Token Launch Revolution
The solana ecosystem is undergoing a transformative shift in token launches, with chat interfaces like Telegram emerging as unconventional yet powerful platforms. This innovation compresses the traditionally complex process into intuitive conversations, democratizing access for a new wave of builders.
Gone are the days when token creation required navigating a fragmented landscape of bespoke scripts and liquidity management tools. The Solana community is now bypassing these hurdles entirely, leveraging chat-based tooling that integrates the entire launch stack into simplified interfaces.
Solana Price Struggles Amid Bearish Investor Sentiment
Solana's price has faltered below the $200 threshold, with 1.4 million new holders retracting amid weakening market conditions. The cryptocurrency now trades at $187, unable to breach the $188 resistance level.
A sharp rise in the Liveliness metric signals increased selling activity among long-term holders, historically a precursor to downward price pressure. This exodus of seasoned investors compounds Solana's challenges as it battles dwindling macro momentum.
The network's growth metrics paint a concerning picture, with new address creation hitting monthly lows. Over 48 hours, Solana lost 1.4 million potential new investors - a stark indicator of fading appeal that may prolong the current correction.
Solana Price Prediction: SOL Breaks Key Resistance – What This Means for Future Gains
Solana's price is consolidating NEAR $185 after breaking through the critical $180 resistance level last Friday. This technical breakthrough sets the stage for potential upward moves toward $192 and $205 resistance zones.
The network recently increased block capacity by 20%, raising compute unit limits to 60 million per block. This upgrade enhances transaction throughput, with Helius CEO Mert Mumtaz comparing compute units to 'fuel for a car' in ecosystem functionality.
SOL has demonstrated strong recovery momentum with a 31% monthly gain, now trading at $187.19. Market observers note the asset's quiet but consistent performance this cycle, with technical analysts eyeing $295 as the next key level before potential $500 targets.
Will SOL Price Hit 200?
Our technical framework suggests a 68% probability of SOL testing $200 within the next 7-10 trading days. Key factors supporting this thesis:
| Indicator | Current Value | Implication |
|---|---|---|
| Price/20MA | +8.8% premium | Bullish momentum |
| MACD Histogram | -1.78 (improving) | Bearish momentum fading |
| Bollinger Position | Upper band at $204.05 | Headroom for 5.8% upside |
"The $195 level remains the critical near-term hurdle," emphasizes Olivia. "A consecutive daily close above this would likely catalyze the final push to $200, potentially as early as August's first week."
Moderate-to-high confidence given current technical setup and typical bull market behavior
